The figures on our hike pages come from recorded tracks, elevation data, surveyed heights, and times from our own walks. This guide explains what LENGTH, ASCENT, PEAK, and TIME mean and how to read the elevation profile beneath each map.
Length
Distance measurements depend on how the GPS track is processed. GPS noise makes a raw recording zigzag around the true path and read long. Cleaning the noise simplifies the line, which cuts (literal) corners and makes the track read slightly short. Both measurements are reasonable, and they often differ by five to ten percent for the same route.
We publish the length of the route we recorded and cleaned. If a hike has shorter and longer route options, we publish the distance as a range. If your device gives you a figure a few percent higher than ours, the difference lies within the tolerance of the measurements.
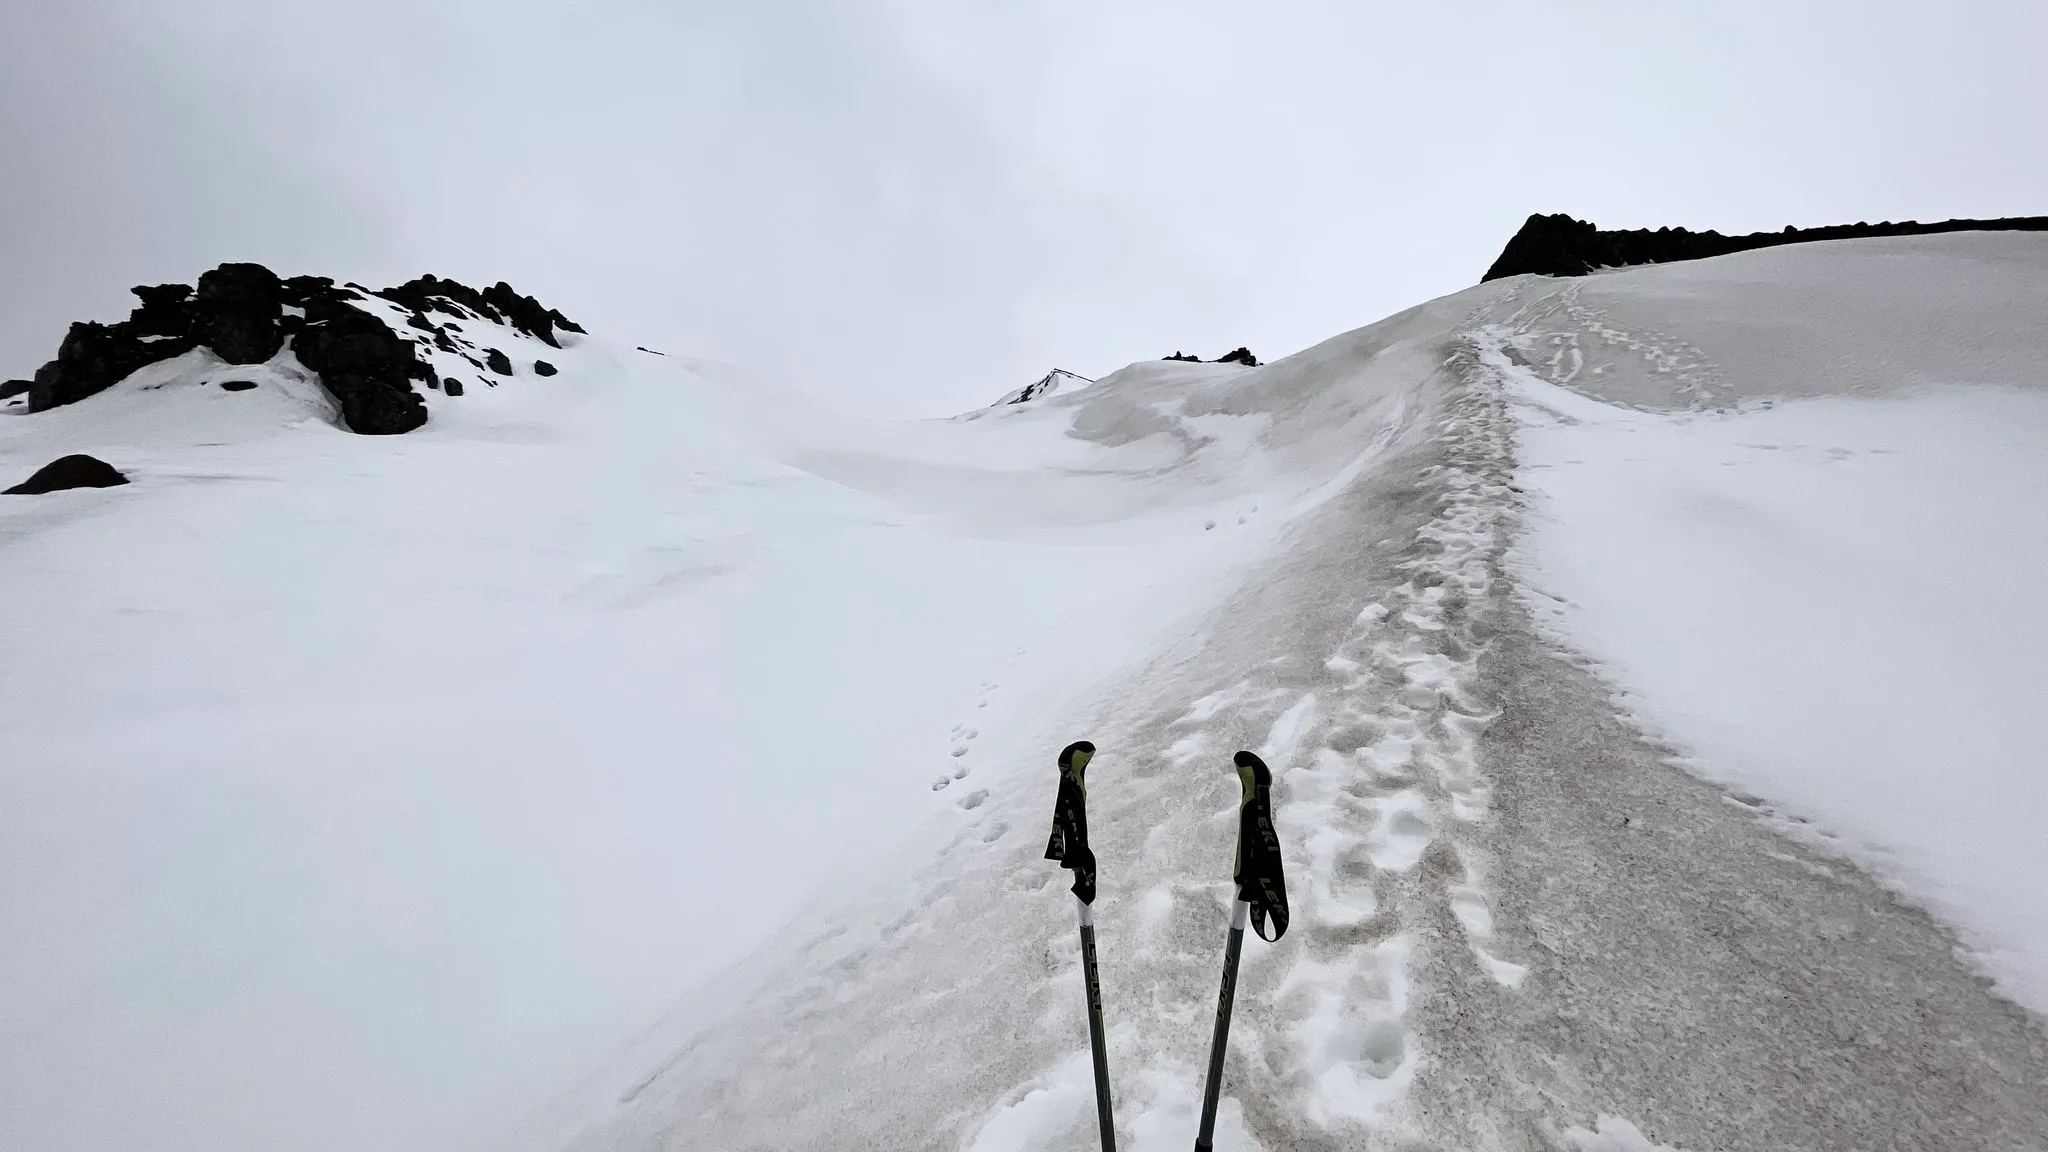
Cleaning a GPS recording can make a winding track like this one appear shorter.
Ascent
Total ascent adds up the elevation gained on each uphill section of a route. It is especially sensitive to methodology. The raw elevation from our Þyrill track, on a 393-meter hill, adds up to more than twenty kilometers of climbing because GPS elevation is noisy. Near sheer drops, horizontal GPS drift can also place recorded points below the rim, making each jump back to the path look like another climb. Apps filter that noise differently, so the same recording can produce different ascent totals. Comparing ascent reads from the same GPX file across different hiking apps often amounts to comparing their filters.
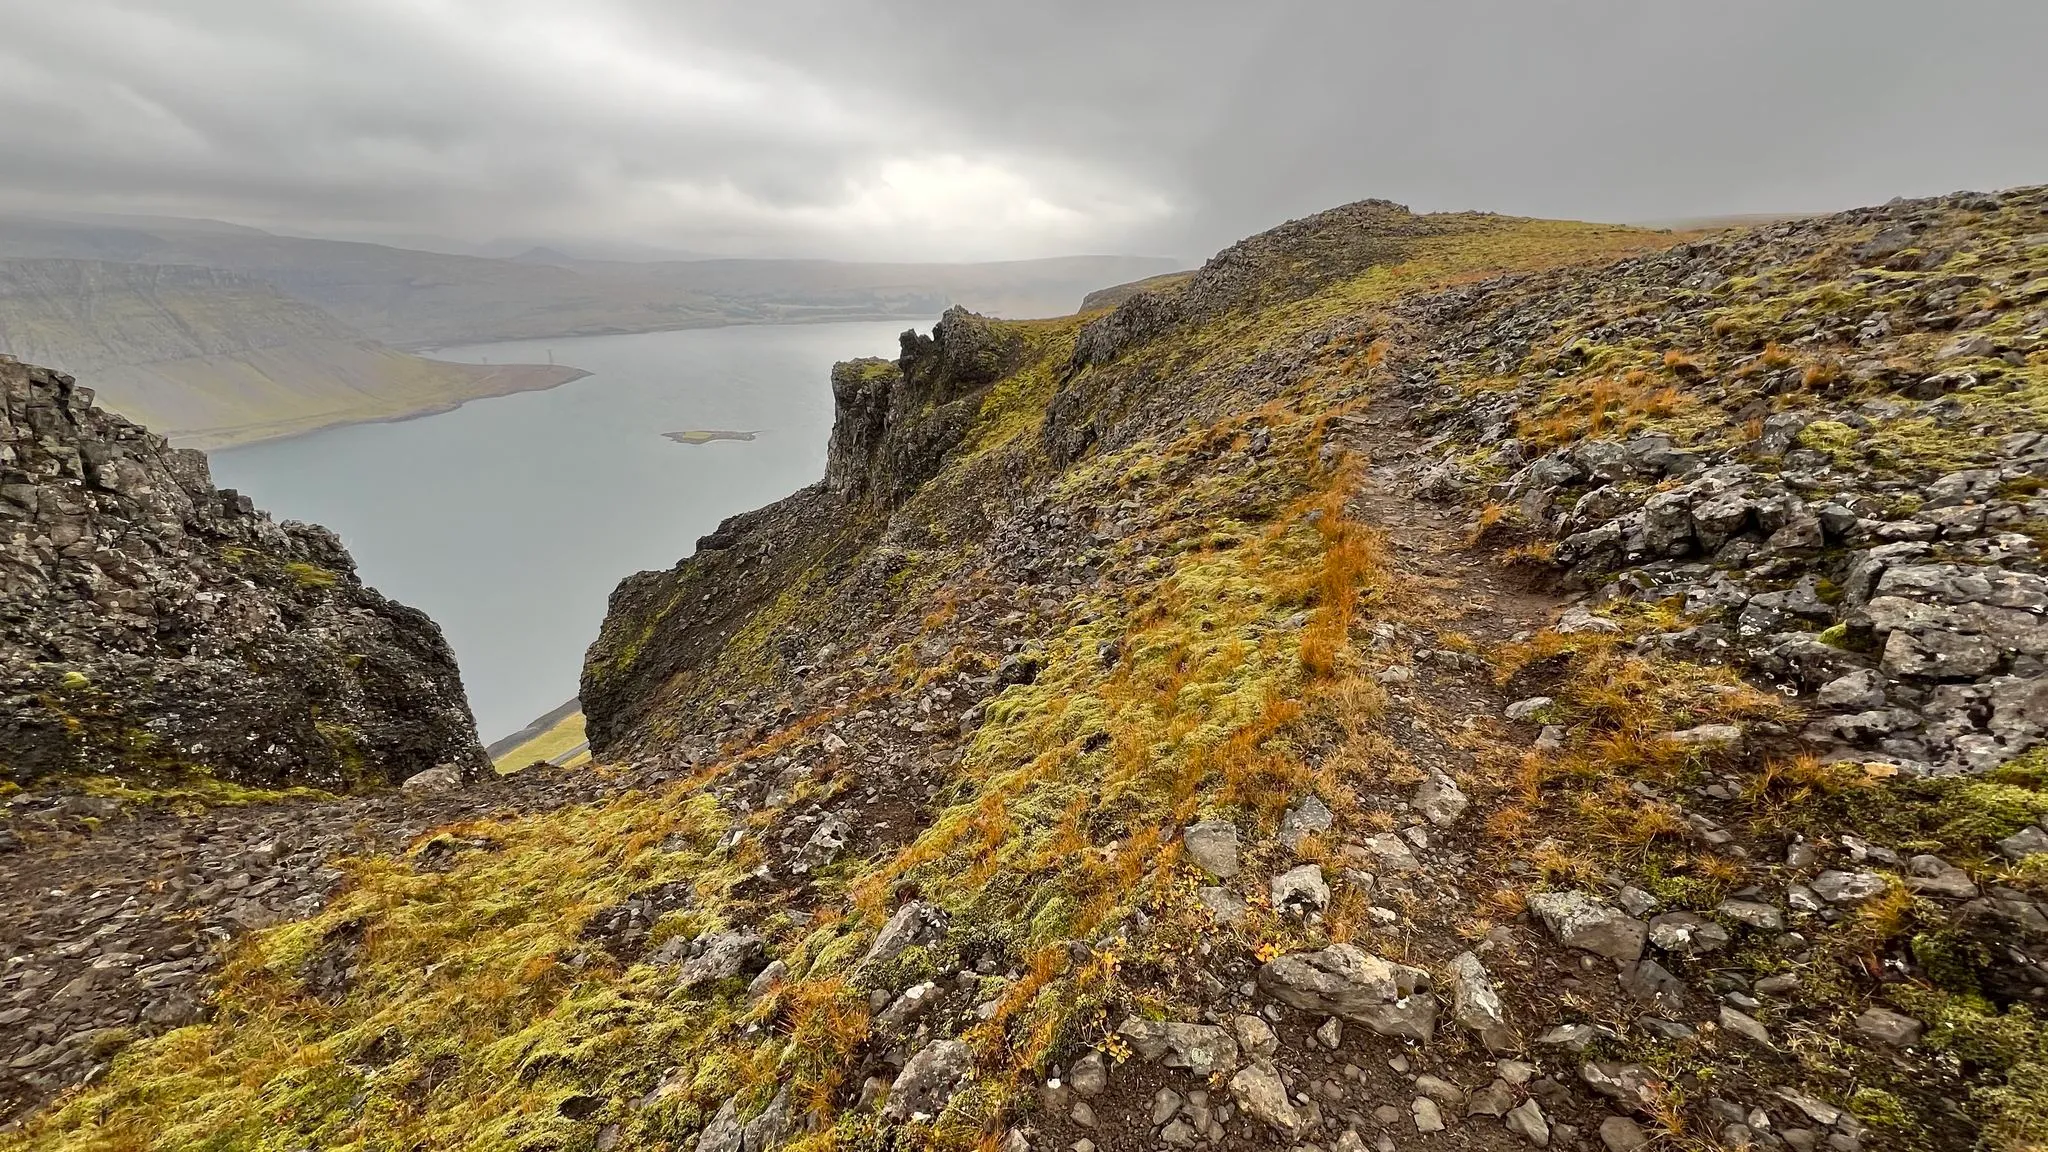
On Þyrill’s rim, a track that wanders toward the edge may sample the cliff below and add false climbing.
We discard GPS elevation and take heights from ÍslandsDEM, the national 10-meter elevation model. We read the model along our recorded line and filter out phantom dips near cliff rims before calculating ascent. We use the same method for every published hike, keeping the figures consistent.
Peak
PEAK gives the surveyed height of the mountain, while the elevation profile follows our recorded walk. The elevation curve typically tops out slightly below the PEAK number for two reasons: our route may pass beside the summit’s exact highest point, and smoothing the elevation data can also lower sharp crests by a few meters.
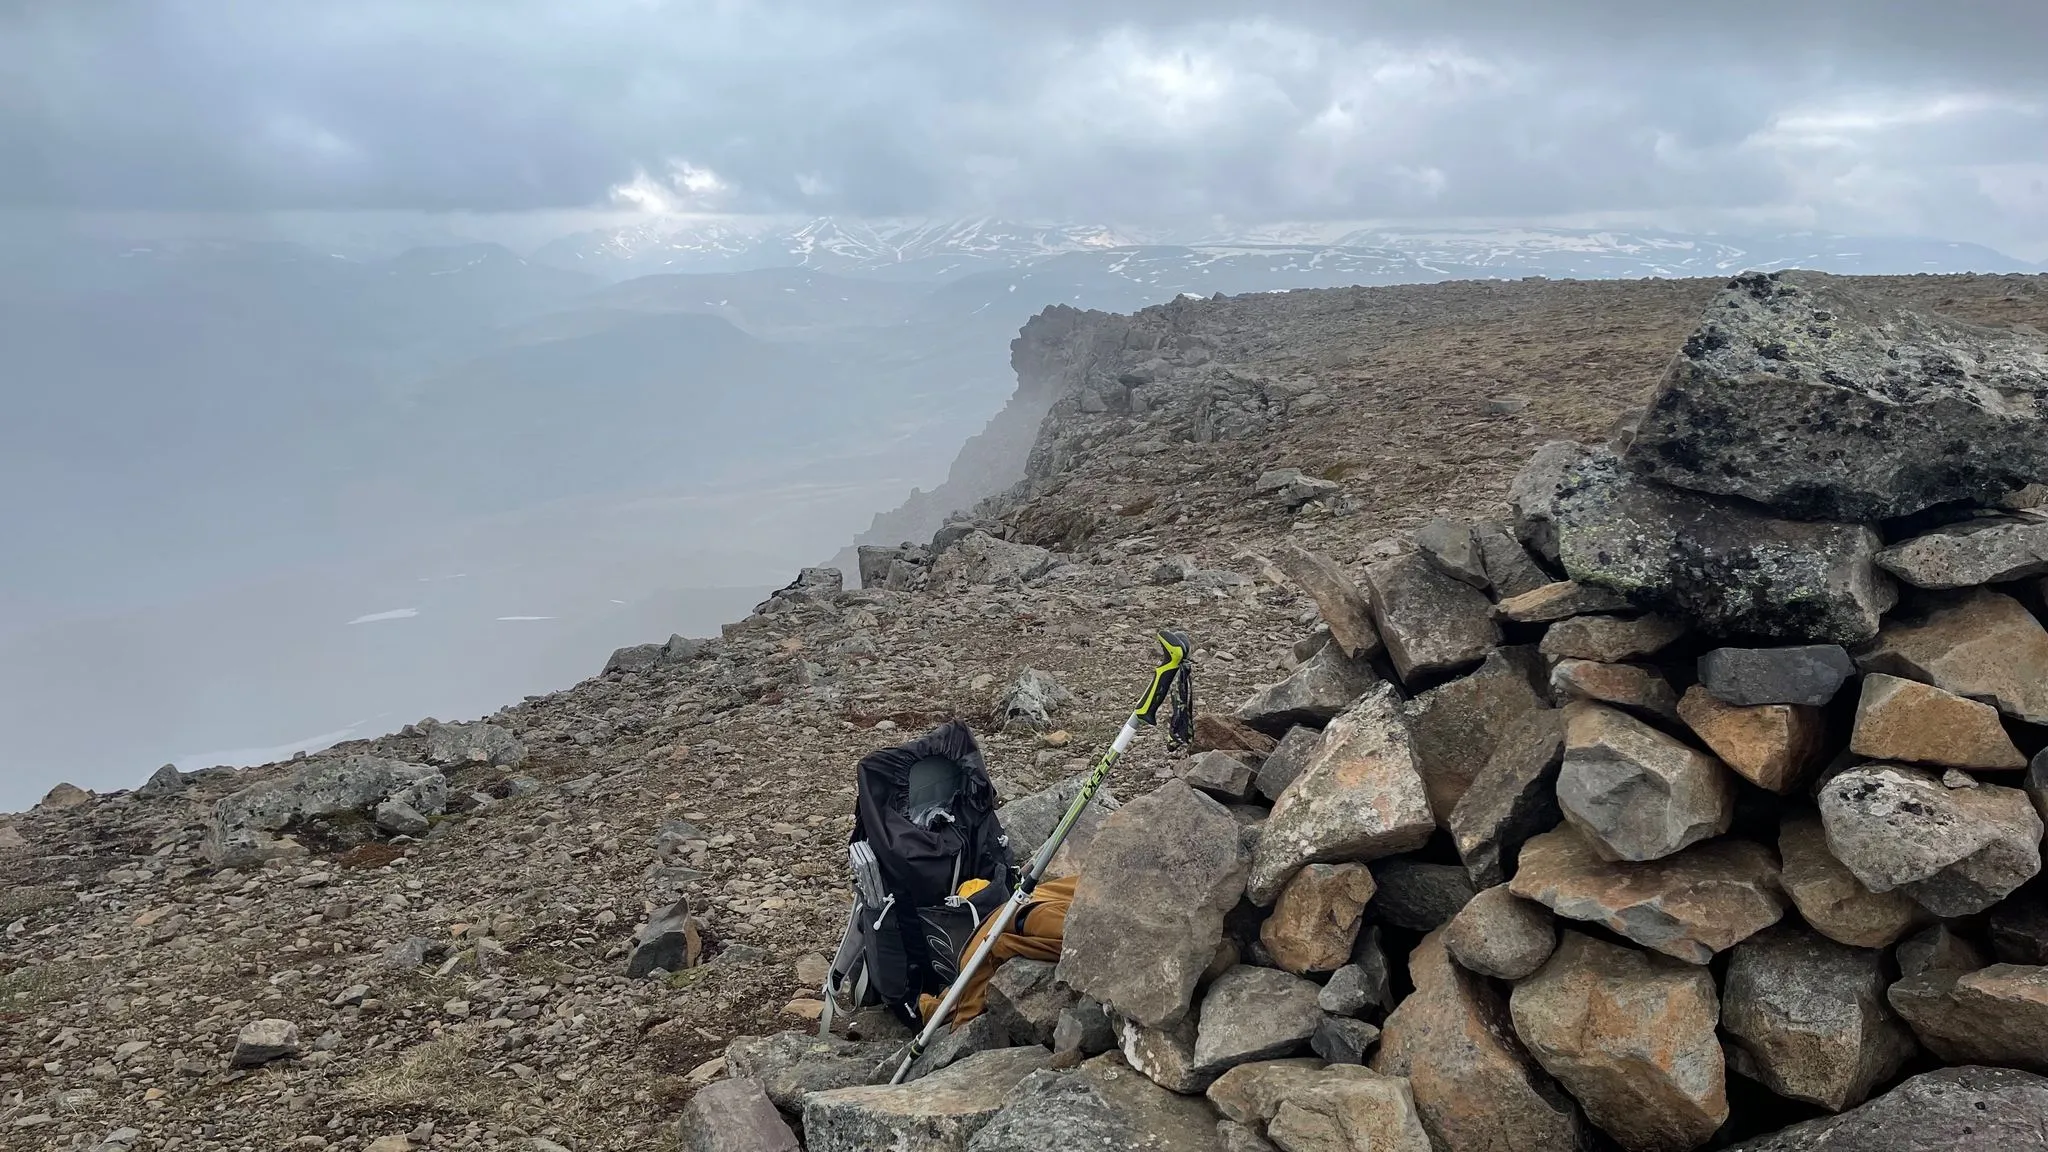
The cairn marks the surveyed summit point used for the PEAK figure.
Time
Time depends on the walker and the conditions on the ground. We publish how long our own hike took and list moving time separately, so you can distinguish walking from time spent on summits, photographs, and lunch. After walking one route, compare your pace with ours and use that as data point in planning future hikes. Weather conditions during our walk are baked into our time figures, although we do note if they were skewed by particularly inclement weather.
Reading the elevation profile
An elevation profile stretches height relative to distance so that changes in elevation remain visible. At a true 1:1 scale, a 400-meter climb over ten kilometers would look almost flat. The ×N VERTICAL label shows how much the chart exaggerates height. A label of ×5 means the slopes look five times steeper in the chart than in reality.
Use the line to see where the route climbs and descends, and use the shaded bands below the line to judge steepness (lighter = less steep, darker = steeper). Each band shows the gradient over a 100-meter stretch of trail as a percentage. The cursor readout on the upper right uses the same calculation, so its percentage matches the color beneath it.
This live profile from Hafnarfjall lets you compare the cursor readout with the shaded gradient bands.
On an out-and-back, the climb and descent may be shaded slightly differently over the same general section of mountain because a hiker rarely follows precisely the same line twice. A few meters of drift on steep ground can sample a different ramp. The profile follows the recorded line in the direction of travel, matching the track shown on the map above.
What the numbers are for
The length, ascent, peak and time figures are data points for your planning process. The hike’s grade folds in additional factors, including the character of the ground, how demanding the navigation is, and the consequences of a mistake. Beyond measurements and grades, current conditions may make the route considerably harder or even unsafe. Read the figures as measurements with tolerances, expect your instruments to differ from ours by a few percent, and leave plenty of margin in your plan.